Jupyter Snippet NP ch10-code-listing
Jupyter Snippet NP ch10-code-listing
Chapter 10: Sparse matrices and graphs
Robert Johansson
Source code listings for Numerical Python - Scientific Computing and Data Science Applications with Numpy, SciPy and Matplotlib (ISBN 978-1-484242-45-2).
%matplotlib inline
%config InlineBackend.figure_format='retina'
import matplotlib.pyplot as plt
import matplotlib as mpl
# mpl.rcParams['text.usetex'] = True
mpl.rcParams['mathtext.fontset'] = 'stix'
mpl.rcParams['font.family'] = 'serif'
mpl.rcParams['font.sans-serif'] = 'stix'
import scipy.sparse as sp
import scipy.sparse.linalg
import numpy as np
import scipy.linalg as la
import networkx as nx
Coordinate list format
values = [1, 2, 3, 4]
rows = [0, 1, 2, 3]
cols = [1, 3, 2, 0]
A = sp.coo_matrix((values, (rows, cols)), shape=[4, 4])
A.todense()
matrix([[0, 1, 0, 0],
        [0, 0, 0, 2],
        [0, 0, 3, 0],
        [4, 0, 0, 0]])
A
<4x4 sparse matrix of type '<class 'numpy.int64'>'
    with 4 stored elements in COOrdinate format>
A.shape, A.size, A.dtype, A.ndim
((4, 4), 4, dtype('int64'), 2)
A.nnz, A.data
(4, array([1, 2, 3, 4]))
A.row
array([0, 1, 2, 3], dtype=int32)
A.col
array([1, 3, 2, 0], dtype=int32)
A.tocsr()
<4x4 sparse matrix of type '<class 'numpy.int64'>'
    with 4 stored elements in Compressed Sparse Row format>
A.toarray()
array([[0, 1, 0, 0],
       [0, 0, 0, 2],
       [0, 0, 3, 0],
       [4, 0, 0, 0]])
A.todense()
matrix([[0, 1, 0, 0],
        [0, 0, 0, 2],
        [0, 0, 3, 0],
        [4, 0, 0, 0]])
Not all sparse matrix formats supports indexing:
A[1, 2]
---------------------------------------------------------------------------

TypeError                                 Traceback (most recent call last)

<ipython-input-21-ddf538d85dd0> in <module>
----> 1 A[1, 2]


TypeError: 'coo_matrix' object is not subscriptable
A.tobsr()[1, 2]
---------------------------------------------------------------------------

NotImplementedError                       Traceback (most recent call last)

<ipython-input-22-d36988c1a0db> in <module>
----> 1 A.tobsr()[1, 2]


~/miniconda3/envs/py3.6/lib/python3.6/site-packages/scipy/sparse/bsr.py in __getitem__(self, key)
    315
    316     def __getitem__(self,key):
--> 317         raise NotImplementedError
    318
    319     def __setitem__(self,key,val):


NotImplementedError:
But some do:
A.tocsr()[1, 2]
0
A.tolil()[1:3, 3]
<2x1 sparse matrix of type '<class 'numpy.int64'>'
    with 1 stored elements in LInked List format>
CSR
A = np.array([[1, 2, 0, 0], [0, 3, 4, 0], [0, 0, 5, 6], [7, 0, 8, 9]]); A
array([[1, 2, 0, 0],
       [0, 3, 4, 0],
       [0, 0, 5, 6],
       [7, 0, 8, 9]])
A = sp.csr_matrix(A)
A.data
array([1, 2, 3, 4, 5, 6, 7, 8, 9], dtype=int64)
A.indices
array([0, 1, 1, 2, 2, 3, 0, 2, 3], dtype=int32)
A.indptr
array([0, 2, 4, 6, 9], dtype=int32)
i = 2
A.indptr[i], A.indptr[i+1]-1
(4, 5)
A.indices[A.indptr[i]:A.indptr[i+1]]
array([2, 3], dtype=int32)
A.data[A.indptr[i]:A.indptr[i+1]]
array([5, 6], dtype=int64)
Functions for constructing sparse matrices
N = 10
A = -2 * sp.eye(N) + sp.eye(N, k=1) + sp.eye(N, k=-1)
A
<10x10 sparse matrix of type '<class 'numpy.float64'>'
    with 28 stored elements in Compressed Sparse Row format>
A.todense()
matrix([[-2.,  1.,  0.,  0.,  0.,  0.,  0.,  0.,  0.,  0.],
        [ 1., -2.,  1.,  0.,  0.,  0.,  0.,  0.,  0.,  0.],
        [ 0.,  1., -2.,  1.,  0.,  0.,  0.,  0.,  0.,  0.],
        [ 0.,  0.,  1., -2.,  1.,  0.,  0.,  0.,  0.,  0.],
        [ 0.,  0.,  0.,  1., -2.,  1.,  0.,  0.,  0.,  0.],
        [ 0.,  0.,  0.,  0.,  1., -2.,  1.,  0.,  0.,  0.],
        [ 0.,  0.,  0.,  0.,  0.,  1., -2.,  1.,  0.,  0.],
        [ 0.,  0.,  0.,  0.,  0.,  0.,  1., -2.,  1.,  0.],
        [ 0.,  0.,  0.,  0.,  0.,  0.,  0.,  1., -2.,  1.],
        [ 0.,  0.,  0.,  0.,  0.,  0.,  0.,  0.,  1., -2.]])
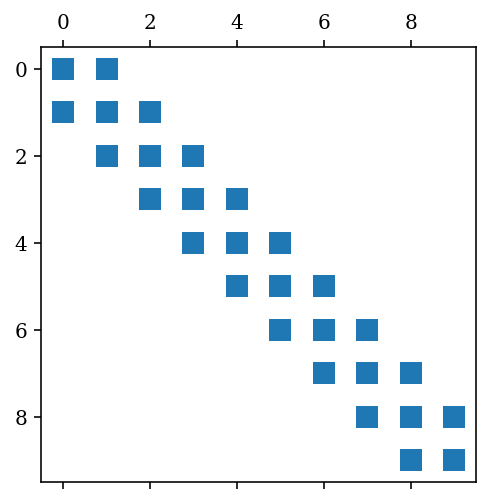
fig, ax = plt.subplots()
ax.spy(A)
fig.savefig("ch10-sparse-matrix-1.pdf");
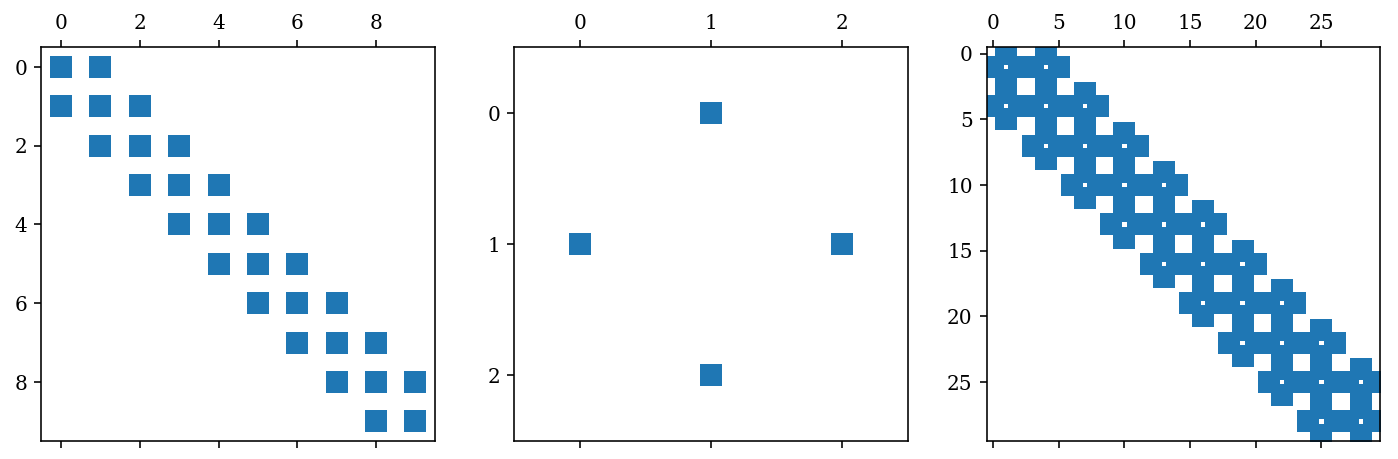
A = sp.diags([1,-2,1], [1,0,-1], shape=[N, N], format='csc')
A
<10x10 sparse matrix of type '<class 'numpy.float64'>'
    with 28 stored elements in Compressed Sparse Column format>
fig, ax = plt.subplots()
ax.spy(A);

B = sp.diags([1, 1], [-1, 1], shape=[3,3])
B
<3x3 sparse matrix of type '<class 'numpy.float64'>'
    with 4 stored elements (2 diagonals) in DIAgonal format>
C = sp.kron(A, B, format='csr')
C
<30x30 sparse matrix of type '<class 'numpy.float64'>'
    with 112 stored elements in Compressed Sparse Row format>
fig, (ax_A, ax_B, ax_C) = plt.subplots(1, 3, figsize=(12, 4))
ax_A.spy(A)
ax_B.spy(B)
ax_C.spy(C)
fig.savefig("ch10-sparse-matrix-2.pdf");
Sparse linear algebra
N = 10
A = sp.diags([1, -2, 1], [1, 0, -1], shape=[N, N], format='csc')
b = -np.ones(N)
x = sp.linalg.spsolve(A, b)
x
array([ 5., 9., 12., 14., 15., 15., 14., 12., 9., 5.])
np.linalg.solve(A.todense(), b)
array([ 5., 9., 12., 14., 15., 15., 14., 12., 9., 5.])
lu = sp.linalg.splu(A)
lu.L
<10x10 sparse matrix of type '<class 'numpy.float64'>'
    with 20 stored elements in Compressed Sparse Column format>
lu.perm_r
array([0, 1, 2, 3, 4, 5, 6, 8, 7, 9], dtype=int32)
lu.U
<10x10 sparse matrix of type '<class 'numpy.float64'>'
    with 20 stored elements in Compressed Sparse Column format>
def sp_permute(A, perm_r, perm_c):
    """ permute rows and columns of A """
    M, N = A.shape
    # row permumation matrix
    Pr = sp.coo_matrix((np.ones(M), (perm_r, np.arange(N)))).tocsr()
    # column permutation matrix
    Pc = sp.coo_matrix((np.ones(M), (np.arange(M), perm_c))).tocsr()
    return Pr.T * A * Pc.T
sp_permute(lu.L * lu.U, lu.perm_r, lu.perm_c) - A
<10x10 sparse matrix of type '<class 'numpy.float64'>'
    with 0 stored elements in Compressed Sparse Column format>
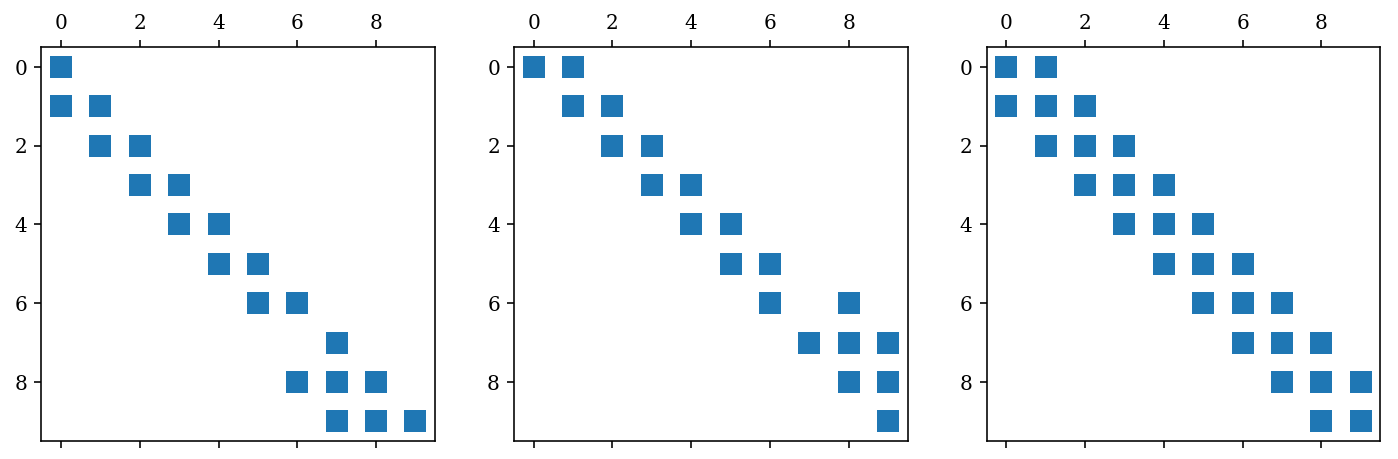
fig, (ax1, ax2, ax3) = plt.subplots(1, 3, figsize=(12, 4))
ax1.spy(lu.L)
ax2.spy(lu.U)
ax3.spy(A)
<matplotlib.lines.Line2D at 0xa19f7f160>
x = lu.solve(b)
x
array([ 5., 9., 12., 14., 15., 15., 14., 12., 9., 5.])
# use_umfpack=True is only effective if scikit-umfpack is installed
# (in which case UMFPACK is the default solver)
x = sp.linalg.spsolve(A, b, use_umfpack=True)
x
array([ 5., 9., 12., 14., 15., 15., 14., 12., 9., 5.])
x, info = sp.linalg.cg(A, b)
x
array([ 5., 9., 12., 14., 15., 15., 14., 12., 9., 5.])
x, info = sp.linalg.bicgstab(A, b)
x
array([ 5., 9., 12., 14., 15., 15., 14., 12., 9., 5.])
# atol argument is a recent addition
x, info = sp.linalg.lgmres(A, b, atol=1e-5)
x
array([ 5., 9., 12., 14., 15., 15., 14., 12., 9., 5.])
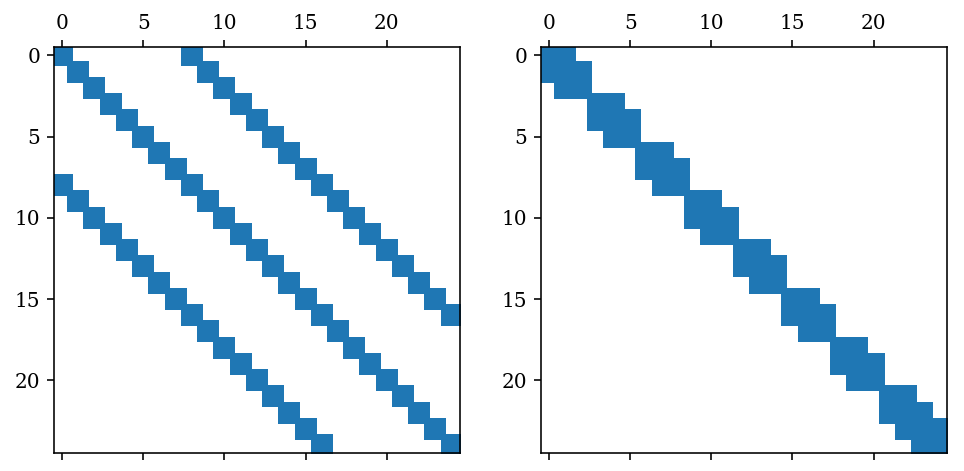
N = 25
An example of a matrix reording method: Reverse Cuthil McKee
A = sp.diags([1, -2, 1], [8, 0, -8], shape=[N, N], format='csc')
perm = sp.csgraph.reverse_cuthill_mckee(A)
perm
array([ 7, 15, 23,  1,  9, 17,  2, 10, 18,  3, 11, 19,  4, 12, 20,  5, 13,
       21,  6, 14, 22, 24, 16,  8,  0], dtype=int32)
fig, (ax1, ax2) = plt.subplots(1, 2, figsize=(8, 4))
ax1.spy(A)
ax2.spy(sp_permute(A, perm, perm))
<matplotlib.lines.Line2D at 0xa1b0e1748>
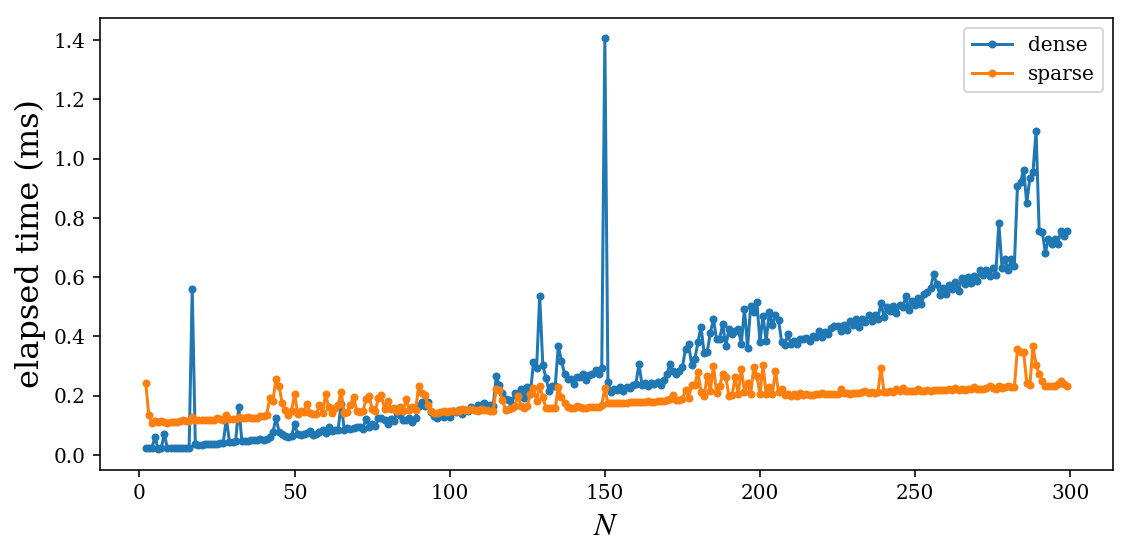
Performance comparison sparse/dense
# compare performance of solving Ax=b vs system size N,
# where A is the sparse matrix for the 1d poisson problem
import time

def setup(N):
    A = sp.diags([1,-2,1], [1,0,-1], shape=[N, N], format='csr')
    b = -np.ones(N)
    return A, A.todense(), b

reps = 10
N_vec = np.arange(2, 300, 1)
t_sparse = np.empty(len(N_vec))
t_dense = np.empty(len(N_vec))
for idx, N in enumerate(N_vec):
    A, A_dense, b = setup(N)
    t = time.time()
    for r in range(reps):
        x = np.linalg.solve(A_dense, b)
    t_dense[idx] = (time.time() - t)/reps
    t = time.time()
    for r in range(reps):
        x = sp.linalg.spsolve(A, b, use_umfpack=True)
    t_sparse[idx] = (time.time() - t)/reps

fig, ax = plt.subplots(figsize=(8, 4))
ax.plot(N_vec, t_dense * 1e3, '.-', label="dense")
ax.plot(N_vec, t_sparse * 1e3, '.-', label="sparse")
ax.set_xlabel(r"$N$", fontsize=16)
ax.set_ylabel("elapsed time (ms)", fontsize=16)
ax.legend(loc=0)
fig.tight_layout()
fig.savefig("ch10-sparse-vs-dense.pdf")
Eigenvalue problems
N = 10
A = sp.diags([1, -2, 1], [1, 0, -1], shape=[N, N], format='csc')
evals, evecs = sp.linalg.eigs(A, k=4, which='LM')
evals
array([-3.91898595+0.j, -3.68250707+0.j, -3.30972147+0.j, -2.83083003+0.j])
np.allclose(A.dot(evecs[:,0]), evals[0] * evecs[:,0])
True
evals, evecs = sp.linalg.eigsh(A, k=4, which='LM')
evals
array([-3.91898595, -3.68250707, -3.30972147, -2.83083003])
evals, evecs = sp.linalg.eigs(A, k=4, which='SR')
evals
array([-3.91898595+0.j, -3.68250707+0.j, -3.30972147+0.j, -2.83083003+0.j])
np.real(evals).argsort()
array([0, 1, 2, 3])
def sp_eigs_sorted(A, k=6, which='SR'):
    """ compute and return eigenvalues sorted by real value """
    evals, evecs = sp.linalg.eigs(A, k=k, which=which)
    idx = np.real(evals).argsort()
    return evals[idx], evecs[idx]
evals, evecs = sp_eigs_sorted(A, k=4, which='SM')
evals
array([-1.16916997+0.j, -0.69027853+0.j, -0.31749293+0.j, -0.08101405+0.j])
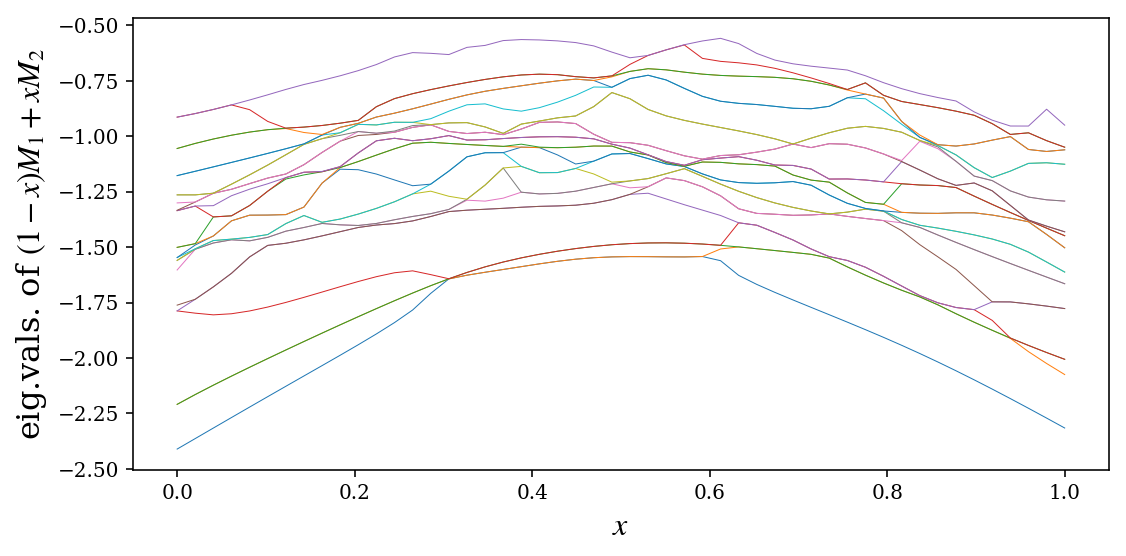
Random matrix example
N = 100
x_vec = np.linspace(0, 1, 50)
# seed sp.rand with random_state to obtain a reproducible result
M1 = sp.rand(N, N, density=0.2, random_state=112312321)
# M1 = M1 + M1.conj().T
M2 = sp.rand(N, N, density=0.2, random_state=984592134)
# M2 = M2 + M2.conj().T
evals = np.array([sp_eigs_sorted((1-x)*M1 + x*M2, k=25)[0] for x in x_vec])
fig, ax = plt.subplots(figsize=(8, 4))

for idx in range(evals.shape[1]):
    ax.plot(x_vec, np.real(evals[:,idx]), lw=0.5)

ax.set_xlabel(r"$x$", fontsize=16)
ax.set_ylabel(r"eig.vals. of $(1-x)M_1+xM_2$", fontsize=16)

fig.tight_layout()
fig.savefig("ch10-sparse-eigs.pdf")
Graphs
g = nx.Graph()
g.add_node(1)
g.nodes()
NodeView((1,))
g.add_nodes_from([3, 4, 5])
g.nodes()
NodeView((1, 3, 4, 5))
g.add_edge(1, 2)
g.edges()
EdgeView([(1, 2)])
g.add_edges_from([(3, 4), (5, 6)])
g.edges()
EdgeView([(1, 2), (3, 4), (5, 6)])
g.add_weighted_edges_from([(1, 3, 1.5), (3, 5, 2.5)])
g.edges()
EdgeView([(1, 2), (1, 3), (3, 4), (3, 5), (5, 6)])
g.edges(data=True)
EdgeDataView([(1, 2, {}), (1, 3, {'weight': 1.5}), (3, 4, {}), (3, 5, {'weight': 2.5}), (5, 6, {})])
g.add_weighted_edges_from([(6, 7, 1.5)])
g.nodes()
NodeView((1, 3, 4, 5, 2, 6, 7))
g.edges()
EdgeView([(1, 2), (1, 3), (3, 4), (3, 5), (5, 6), (6, 7)])
import numpy as np
import json
with open("tokyo-metro.json") as f:
    data = json.load(f)
data.keys()
dict_keys(['C', 'G', 'F', 'H', 'M', 'N', 'T', 'Y', 'Z'])
data["C"]
{'color': '#149848',
 'transfers': [['C3', 'F15'],
  ['C4', 'Z2'],
  ['C4', 'G2'],
  ['C7', 'M14'],
  ['C7', 'N6'],
  ['C7', 'G6'],
  ['C8', 'M15'],
  ['C8', 'H6'],
  ['C9', 'H7'],
  ['C9', 'Y18'],
  ['C11', 'T9'],
  ['C11', 'M18'],
  ['C11', 'Z8'],
  ['C12', 'M19'],
  ['C18', 'H21']],
 'travel_times': [['C1', 'C2', 2],
  ['C2', 'C3', 2],
  ['C3', 'C4', 1],
  ['C4', 'C5', 2],
  ['C5', 'C6', 2],
  ['C6', 'C7', 2],
  ['C7', 'C8', 1],
  ['C8', 'C9', 3],
  ['C9', 'C10', 1],
  ['C10', 'C11', 2],
  ['C11', 'C12', 2],
  ['C12', 'C13', 2],
  ['C13', 'C14', 2],
  ['C14', 'C15', 2],
  ['C15', 'C16', 2],
  ['C16', 'C17', 3],
  ['C17', 'C18', 3],
  ['C18', 'C19', 3]]}
# data
g = nx.Graph()

for line in data.values():
    g.add_weighted_edges_from(line["travel_times"])
    g.add_edges_from(line["transfers"])
for n1, n2 in g.edges():
    g[n1][n2]["transfer"] = "weight" not in g[n1][n2]
g.number_of_nodes()
184
list(g.nodes())[:5]
['C1', 'C2', 'C3', 'C4', 'C5']
g.number_of_edges()
243
list(g.edges())[:5]
[('C1', 'C2'), ('C2', 'C3'), ('C3', 'C4'), ('C3', 'F15'), ('C4', 'C5')]
on_foot = [edge for edge in g.edges() if g.get_edge_data(*edge)["transfer"]]
on_train = [edge for edge in g.edges() if not g.get_edge_data(*edge)["transfer"]]
colors = [data[n[0].upper()]["color"] for n in g.nodes()]
# from networkx.drawing.nx_agraph import graphviz_layout
fig, ax = plt.subplots(1, 1, figsize=(14, 10))

pos = nx.drawing.nx_agraph.graphviz_layout(g, prog="neato")
nx.draw(g, pos, ax=ax, node_size=200, node_color=colors)
nx.draw_networkx_labels(g, pos=pos, ax=ax, font_size=6)
nx.draw_networkx_edges(g, pos=pos, ax=ax, edgelist=on_train, width=2)
nx.draw_networkx_edges(g, pos=pos, ax=ax, edgelist=on_foot, edge_color="blue")

# removing the default axis on all sides:
for side in ['bottom','right','top','left']:
    ax.spines[side].set_visible(False)

# removing the axis labels and ticks
ax.set_xticks([])
ax.set_yticks([])
ax.xaxis.set_ticks_position('none')
ax.yaxis.set_ticks_position('none')

fig.savefig("ch10-metro-graph.pdf")
fig.savefig("ch10-metro-graph.png")
fig.tight_layout()
/Users/rob/miniconda3/envs/py3.6/lib/python3.6/site-packages/matplotlib/font_manager.py:1241: UserWarning: findfont: Font family ['sans-serif'] not found. Falling back to DejaVu Sans.
  (prop.get_family(), self.defaultFamily[fontext]))
g.degree()
DegreeView({'C1': 1, 'C2': 2, 'C3': 3, 'C4': 4, 'C5': 2, 'C6': 2, 'C7': 5, 'C8': 4, 'C9': 4, 'C10': 2, 'C11': 5, 'C12': 3, 'C13': 2, 'C14': 2, 'C15': 2, 'C16': 2, 'C17': 2, 'C18': 3, 'C19': 1, 'F15': 3, 'Z2': 4, 'G2': 4, 'M14': 5, 'N6': 5, 'G6': 5, 'M15': 4, 'H6': 4, 'H7': 4, 'Y18': 4, 'T9': 5, 'M18': 5, 'Z8': 5, 'M19': 3, 'H21': 2, 'G1': 3, 'G3': 2, 'G4': 3, 'G5': 6, 'G7': 2, 'G8': 2, 'G9': 4, 'G10': 2, 'G11': 3, 'G12': 3, 'G13': 2, 'G14': 2, 'G15': 3, 'G16': 3, 'G17': 2, 'G18': 2, 'G19': 1, 'Z1': 3, 'F16': 3, 'Z3': 3, 'M13': 6, 'Y16': 6, 'Z4': 6, 'N7': 6, 'M16': 4, 'H8': 4, 'T10': 3, 'Z9': 3, 'H16': 3, 'H17': 3, 'F1': 2, 'F2': 3, 'F3': 3, 'F4': 3, 'F5': 3, 'F6': 3, 'F7': 3, 'F8': 3, 'F9': 4, 'F10': 2, 'F11': 2, 'F12': 2, 'F13': 3, 'F14': 2, 'Y1': 2, 'Y2': 3, 'Y3': 3, 'Y4': 3, 'Y5': 3, 'Y6': 3, 'Y7': 3, 'Y8': 3, 'Y9': 4, 'M25': 3, 'M9': 3, 'H1': 1, 'H2': 2, 'H3': 2, 'H4': 2, 'H5': 2, 'H9': 2, 'H10': 2, 'H11': 2, 'H12': 3, 'H13': 2, 'H14': 2, 'H15': 2, 'H18': 2, 'H19': 2, 'H20': 2, 'T11': 3, 'M1': 1, 'M2': 2, 'M3': 2, 'M4': 2, 'M5': 2, 'M6': 3, 'M7': 2, 'M8': 2, 'M10': 2, 'M11': 2, 'M12': 3, 'M17': 2, 'M20': 2, 'M21': 2, 'M22': 3, 'M23': 2, 'M24': 2, 'm3': 1, 'm4': 2, 'm5': 2, 'N8': 3, 'N11': 3, 'N1': 2, 'N2': 3, 'N3': 3, 'N4': 2, 'N5': 2, 'N9': 3, 'N10': 4, 'N12': 2, 'N13': 2, 'N14': 2, 'N15': 2, 'N16': 2, 'N17': 2, 'N18': 2, 'N19': 1, 'T1': 2, 'T2': 3, 'T3': 3, 'Y14': 3, 'Y13': 4, 'T6': 4, 'T4': 2, 'T5': 2, 'T7': 3, 'T8': 2, 'T12': 2, 'T13': 2, 'T14': 2, 'T15': 2, 'T16': 2, 'T17': 2, 'T18': 2, 'T19': 2, 'T20': 2, 'T21': 2, 'T22': 2, 'T23': 2, 'T24': 1, 'Z6': 3, 'Y10': 2, 'Y11': 2, 'Y12': 2, 'Y15': 2, 'Y17': 2, 'Y19': 2, 'Y20': 2, 'Y21': 2, 'Y22': 2, 'Y23': 2, 'Y24': 1, 'Z5': 2, 'Z7': 2, 'Z10': 2, 'Z11': 2, 'Z12': 2, 'Z13': 2, 'Z14': 1})
d_max = max(d for (n, d) in g.degree())
[(n, d) for (n, d) in g.degree() if d == d_max]
[('G5', 6), ('M13', 6), ('Y16', 6), ('Z4', 6), ('N7', 6)]
p = nx.shortest_path(g, "Y24", "C19")
np.array(p)
array(['Y24', 'Y23', 'Y22', 'Y21', 'Y20', 'Y19', 'Y18', 'C9', 'C10',
       'C11', 'C12', 'C13', 'C14', 'C15', 'C16', 'C17', 'C18', 'C19'],
      dtype='<U3')
np.sum([g[p[n]][p[n+1]]["weight"] for n in range(len(p)-1) if "weight" in g[p[n]][p[n+1]]])
35
h = g.copy()
for n1, n2 in h.edges():
    if "transfer" in h[n1][n2]:
        h[n1][n2]["weight"] = 5
p = nx.shortest_path(h, "Y24", "C19")
np.array(p)
array(['Y24', 'Y23', 'Y22', 'Y21', 'Y20', 'Y19', 'Y18', 'C9', 'C10',
       'C11', 'C12', 'C13', 'C14', 'C15', 'C16', 'C17', 'C18', 'C19'],
      dtype='<U3')
np.sum([h[p[n]][p[n+1]]["weight"] for n in range(len(p)-1)])
85
p = nx.shortest_path(h, "Z1", "H16")
np.sum([h[p[n]][p[n+1]]["weight"] for n in range(len(p)-1)])
65
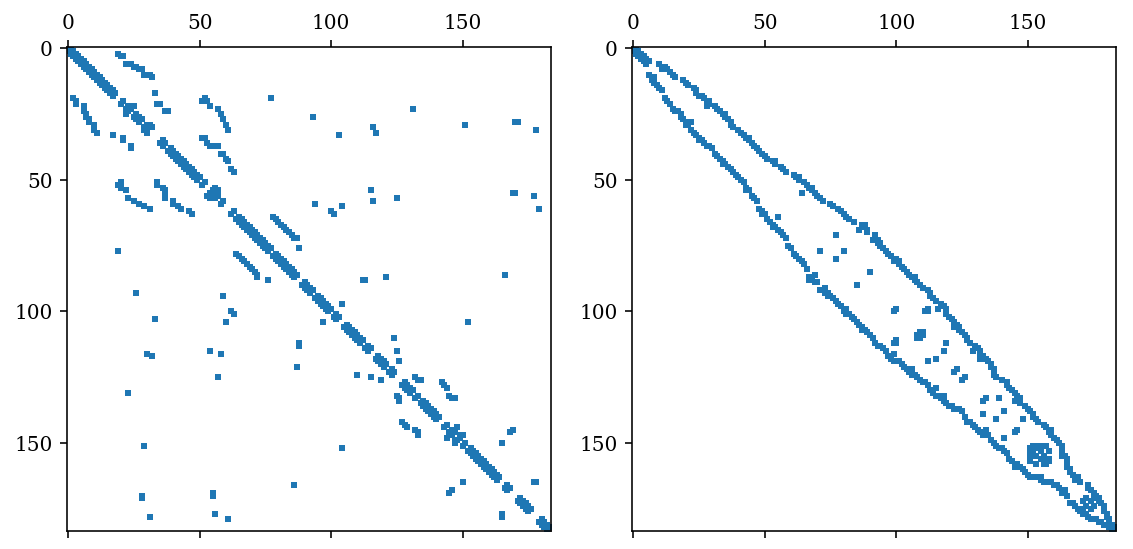
A = nx.to_scipy_sparse_matrix(g)
A
<184x184 sparse matrix of type '<class 'numpy.int64'>'
    with 486 stored elements in Compressed Sparse Row format>
perm = sp.csgraph.reverse_cuthill_mckee(A)
fig, (ax1, ax2) = plt.subplots(1, 2, figsize=(8, 4))
ax1.spy(A, markersize=2)
ax2.spy(sp_permute(A, perm, perm), markersize=2)
fig.tight_layout()
fig.savefig("ch12-rcm-graph.pdf")
Versions
%reload_ext version_information
%version_information numpy, scipy, matplotlib, networkx, pygraphviz